Disclosure: This page contains affiliate links. We may earn a commission if you sign up through our links — at no extra cost to you. It never affects our reviews or the public Trust Score.
How To Screen ETFs For Beginners: Start Here |
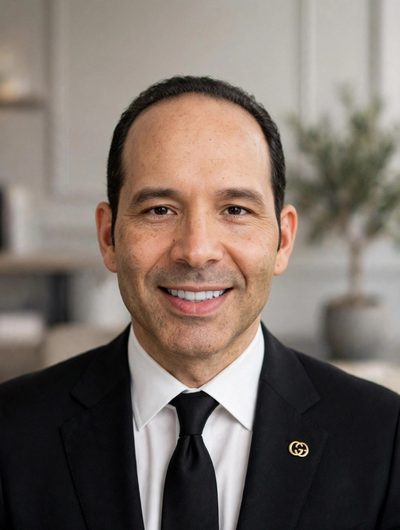 Written by Renan Filho, Technology & AI specialist. Expiry dates and activation fees are always visible.
Quick Answer: Screen ETFs by expense ratio, liquidity, and tracking error. Start here for a simple process. Focus on low costs and daily volume. Avoid complex leveraged products. Use free tools to compare. This guide builds your screening routine in minutes.
Key Facts for US Traders (2026)
| Market | Detail | Source |
|---|---|---|
| US indices | S&P 500, NASDAQ, Dow Jones | NYSE / NASDAQ |
| Regulator | CFTC (futures) / SEC (securities) | Official |
| Prop firm model | Funded evaluations with profit split 70-95% | Vendor terms |
| Verification | Updated regularly | PropFirmDiscountApp |
| Best deal today | Code DISCOUNTAPP — up to 90% off | Updated regularly |
Know Your Costs First
Expense ratio eats returns. Look for ETFs under 0.20%. A $10,000 position with 0.50% costs you $50 per year. With 0.10%, you pay $10. That difference adds up. Check the fund's prospectus. Avoid high-fee thematic ETFs. They often underperform. Stick with broad index funds for your core.
Check Daily Liquidity
Liquidity matters for entry and exit. Use average daily dollar volume, not just volume. A fund with 1 million shares traded but at $5 has low dollar volume. Look for over $10 million in daily dollar volume. The bid-ask spread should be tight. Under 0.10% is a good deal. Liquid ETFs deliver a smooth process.
Tracking Error Tells the Truth
Tracking error shows how well the ETF follows its index. Lower is better. Compare the ETF's returns to the benchmark over 3 years. An annual gap under 0.30% is solid. Bigger gaps mean hidden costs or bad sampling. Check the fund's fact sheet. Do not ignore tax efficiency. Higher distributions reduce your net return.
Use Free Screeners for Quick Filters
Do not pay for tools if you are a beginner. Yahoo Finance and Fidelity offer strong screeners. Set filters: expense ratio under 0.30%, AUM above $100M, and daily volume above $500K. Sort by trailing returns. Then read the fund's holdings. A few minutes of screening saves you from bad ETFs. Those free tools are enough.
Avoid Overlapping Positions
Overlap happens when you buy multiple ETFs with the same stocks. Holding SPY and VOO gives you nearly the same S&P 500 exposure. Check the overlap tool on ETF.com. Keep overlap under 10% between holdings. Add sector funds only if you are comfortable with risk. A simple core-and-satellite strategy works best. Do not complicate your portfolio.
Quick Comparison
| Fundo | Despesa | Liquidez Diária |
|---|---|---|
| VOO (S&P 500) | 0.03% | $30B |
| VTI (Total Market) | 0.03% | $15B |
| QQQ (Nasdaq-100) | 0.20% | $20B |
| EFA (Internacional) | 0.33% | $5B |
| BND (Títulos) | 0.03% | $4B |
Frequently Asked Questions
What is a good expense ratio for an ETF?
Under 0.20% is a good deal for broad index funds. Anything above 0.50% need special reasons.
How much does ETF turnover matter?
High turnover means more trading costs and possible capital gains. Check annual turnover below 20%.
Why is bid-ask spread important?
A wide spread makes you pay extra to buy and sell. Keep it under 0.10% for smooth trades.
Are dividend ETFs better for beginners?
They are worth it if you want income, but total return funds like VTI work better for growth.
Should I screen by AUM or daily volume?
Use both. AUM above $100M avoids delisting risk, and daily volume above $500K gives liquidity.
Conclusion
Screening ETFs is simple when you focus on costs, liquidity, and tracking error. Use free tools, compare your picks, and avoid overlaps. Start your first ETF screen today. Pick two or three low-cost funds and build your plan. Do it now.
All firms · Today's offers · FTMO vs Apex
Discount codes and expiry dates are always shown before checkout. See how we rank firms on our methodology page.
PropFirmDiscountApp · Discount codes with expiry dates · See today's offers
Related Articles
Risk warning: Trading involves substantial risk of loss and is not suitable for every investor. Past performance is not indicative of future results. Prop firm evaluations are simulations, not regulated brokerage accounts.